Earth (ESD) Earth Explore Climate Change Science in Action Multimedia Data For Researchers About Us 4 min read
NASA Study: Crops, Forests Responding to Changing Rainfall Patterns 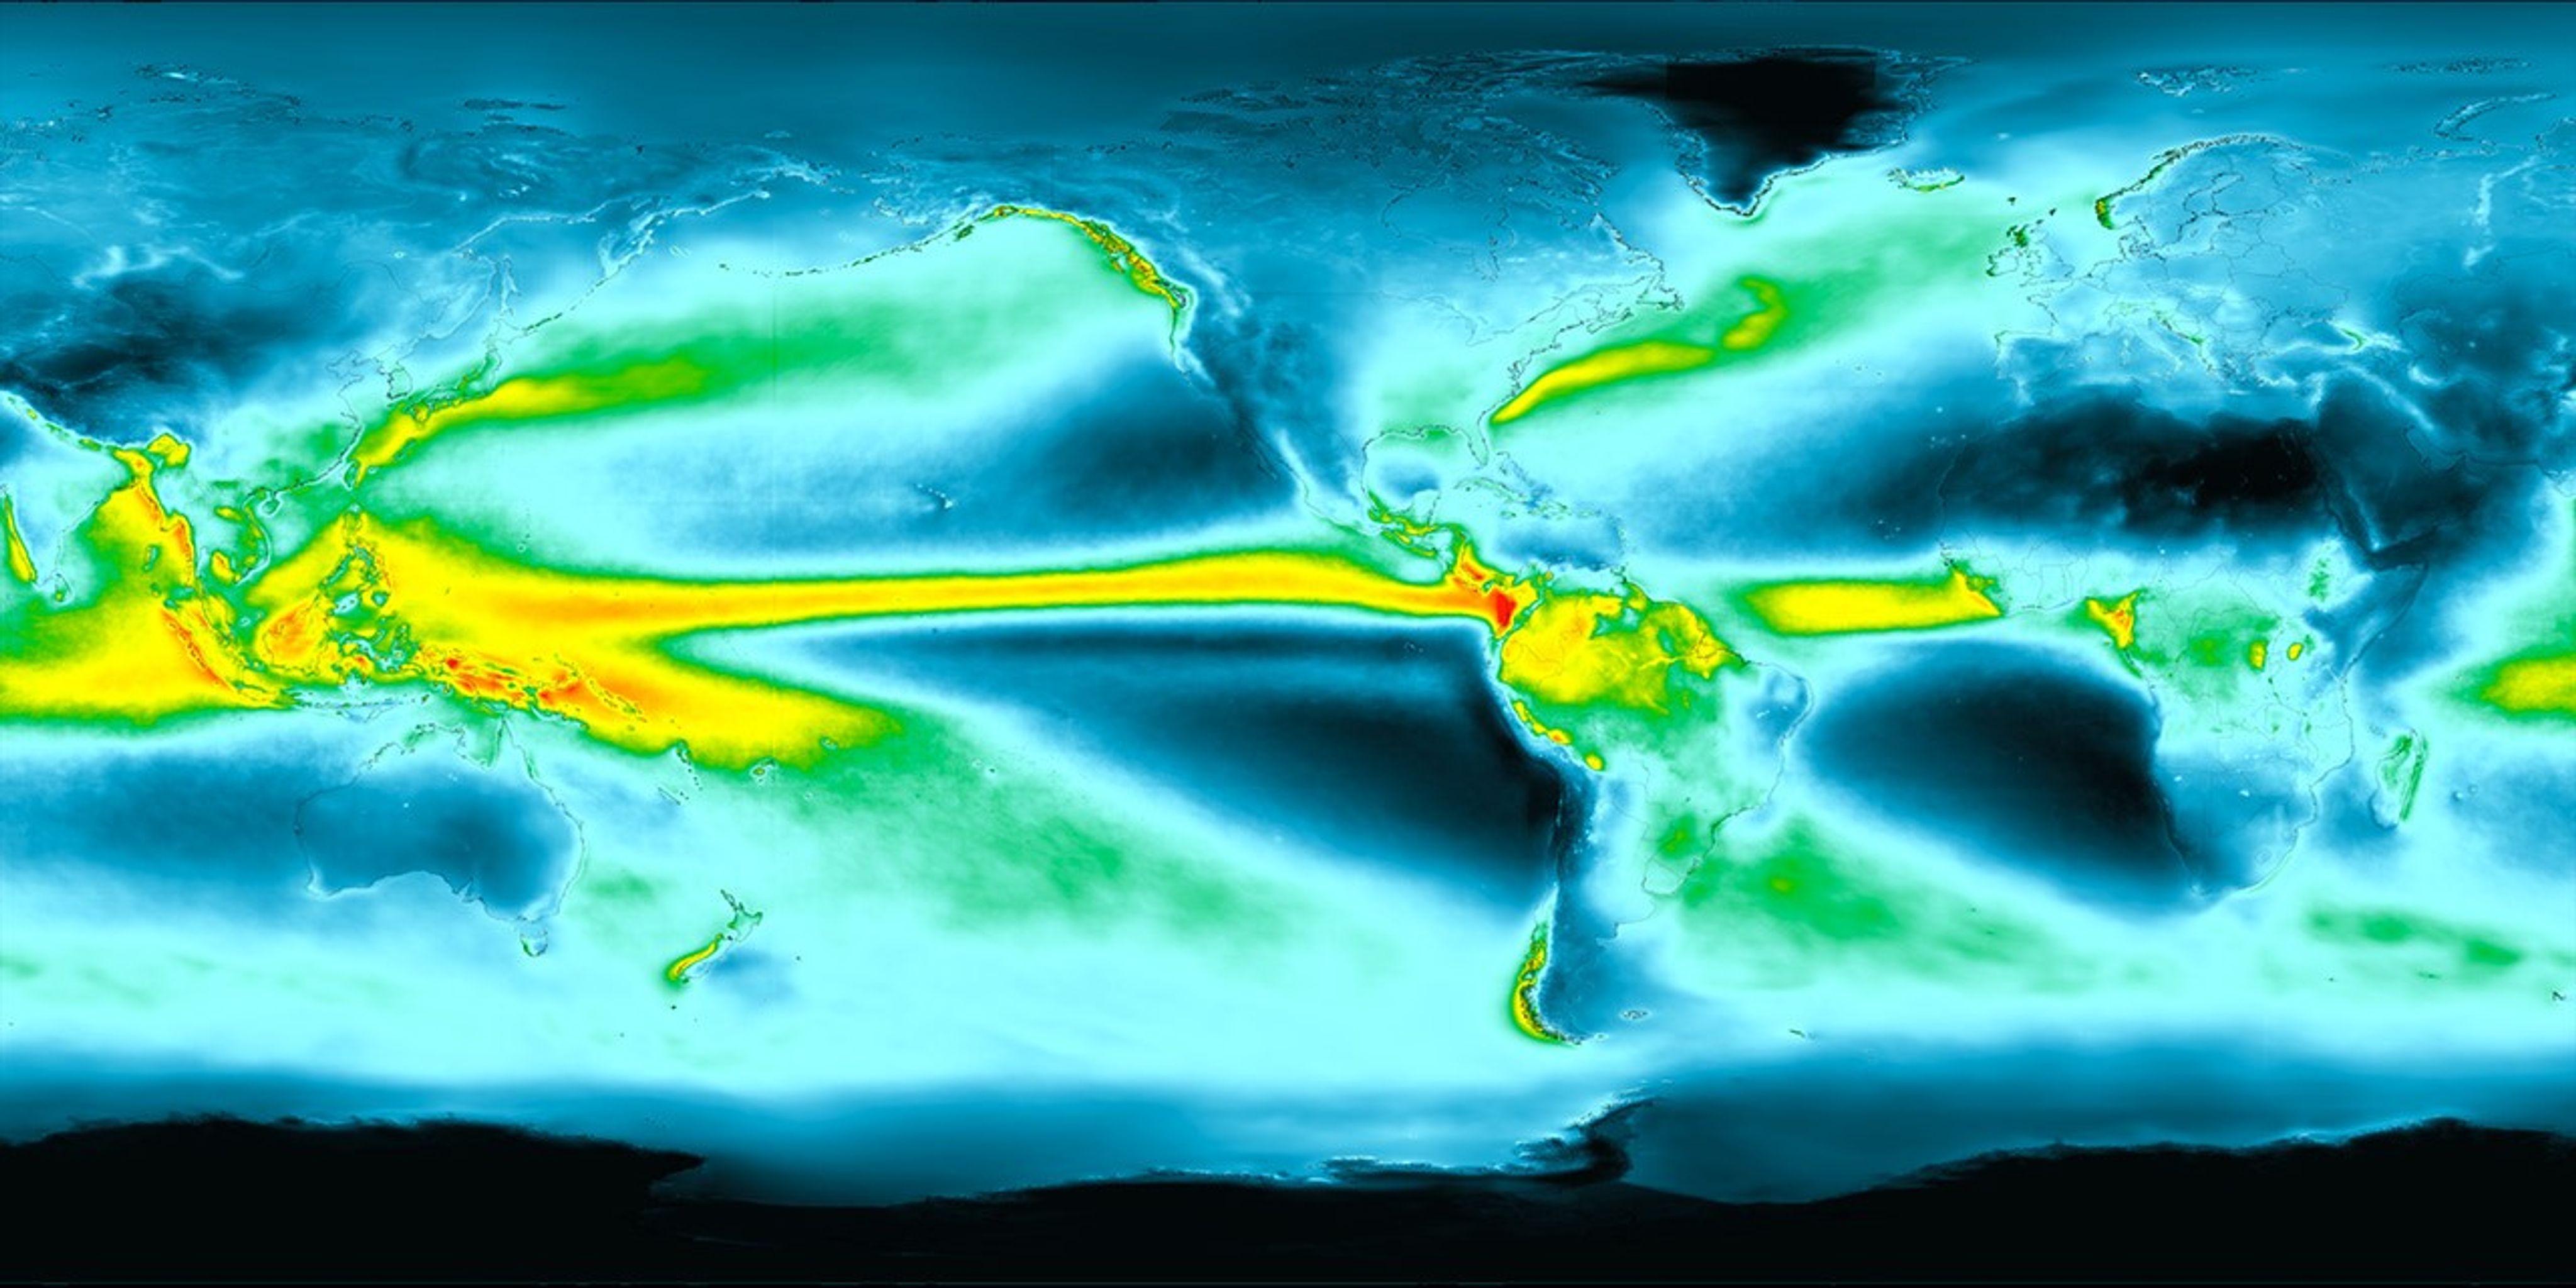
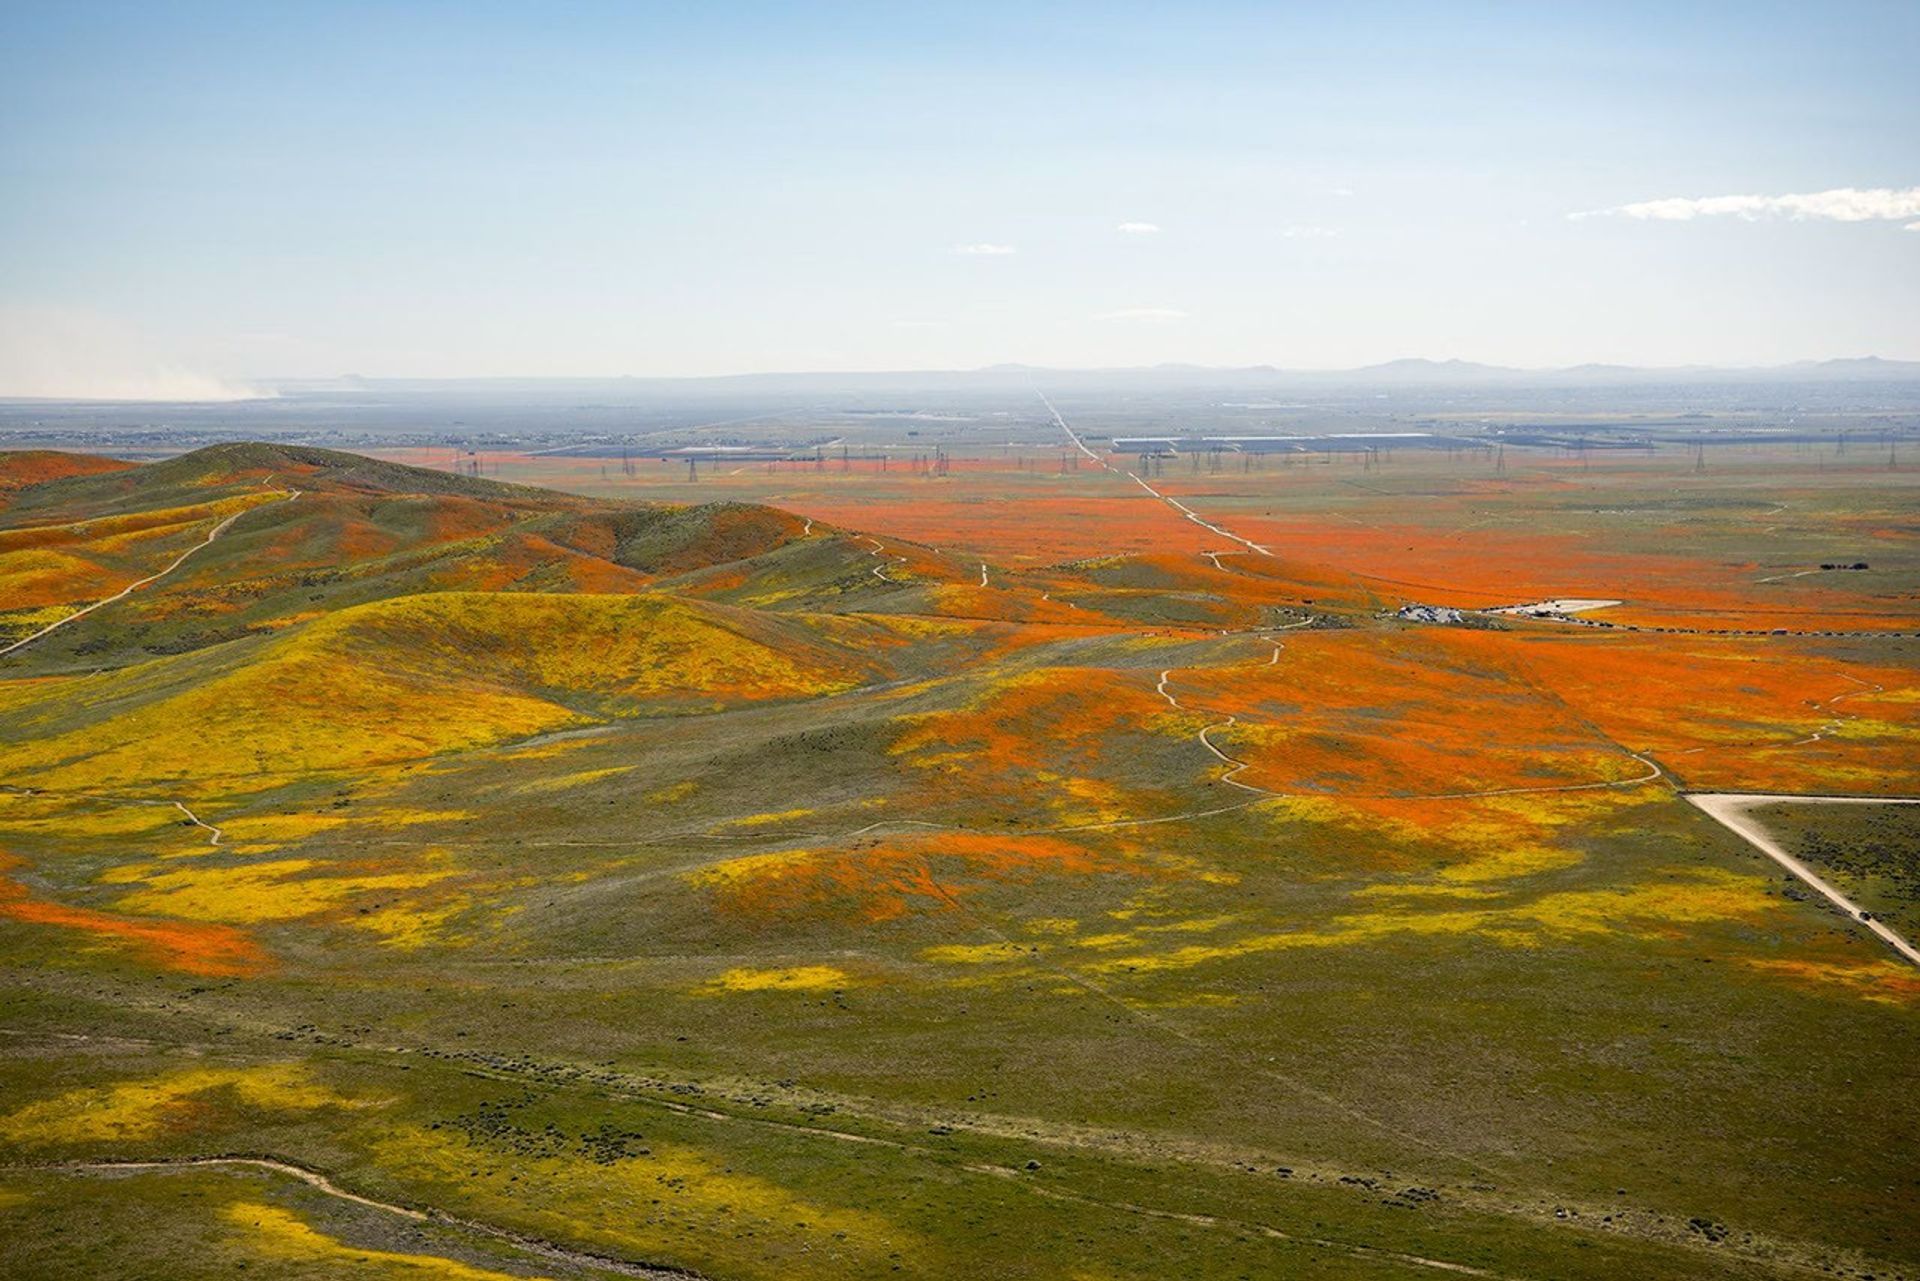
In years with less frequent but more concentrated rainfall, plants in drier environments like the U.S. Southwest were more likely to thrive. In humid ecosystems like the Central American rainforest, vegetation tended to fare worse, possibly because it could not tolerate the longer dry spells.
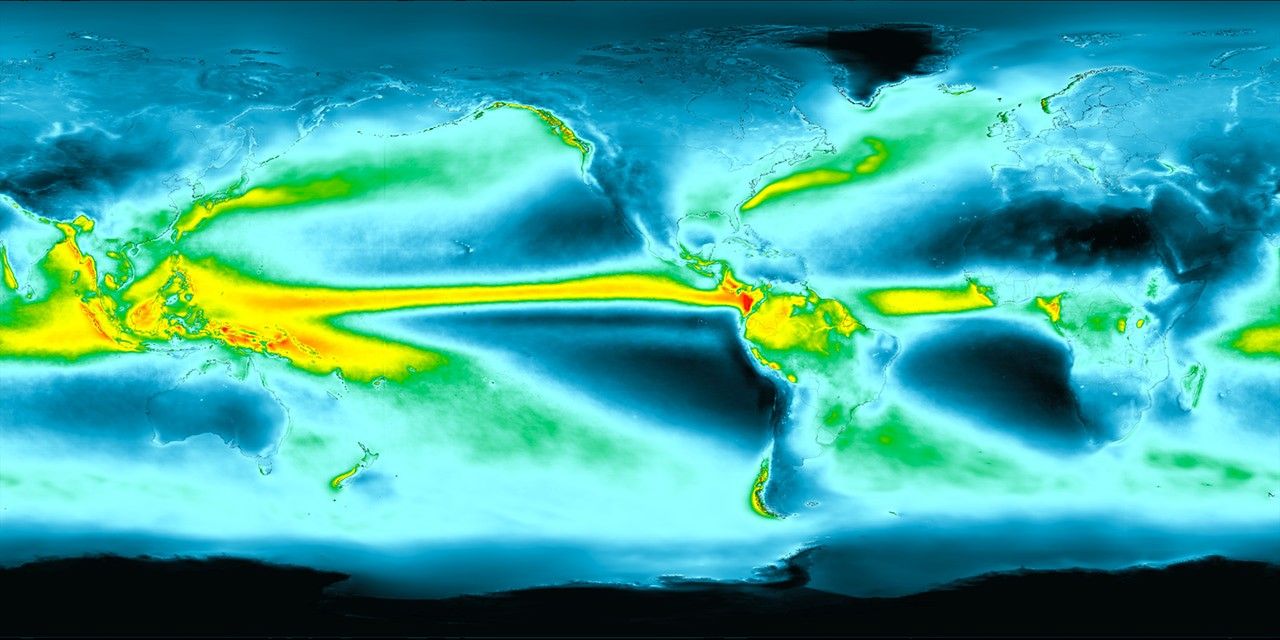
Scientists have previously estimated that almost half of the world’s vegetation is driven primarily by how much rain falls in a year. Less well understood is the role of day-to-day variability, said lead author Andrew Feldman, a hydrologist and ecosystem scientist at NASA’s Goddard Space Flight Center in Greenbelt, Maryland. Shifting precipitation patterns are producing stronger rainstorms — with longer dry spells in between — compared to a century ago.
“You can think of it like this: if you have a house plant, what happens if you give it a full pitcher of water on Sunday versus a third of a pitcher on Monday, Wednesday, and Friday?” said Feldman. Scale that to the size of the U.S. Corn Belt or a rainforest and the answer could have implications for crop yields and ultimately how much carbon dioxide plants remove from the atmosphere.
Blooms in Desert The team, including researchers from the U.S. Department of Agriculture and multiple universities, analyzed two decades of field and satellite observations, spanning millions of square miles. Their study area encompassed diverse landscapes from Siberia to the southern tip of Patagonia.
In contrast, broadleaf (e.g., oak, maple, and beech) forests and rainforests in lower and middle latitudes tended to fare worse under those conditions. The effect was especially pronounced in Indo-Pacific rainforests, including in the Philippines and Indonesia.
Statistically, daily rainfall variability was nearly as important as annual rainfall totals in driving growth worldwide.
Red Light, Green Light The new study relied primarily on a suite of NASA missions and datasets, including the Integrated Multi-satellitE Retrievals for GPM (IMERG) algorithm, which provides rain and snowfall rates for most of the planet every 30 minutes using a network of international satellites.
To gauge plant response day to day, the researchers calculated how green an area appeared in satellite imagery. “Greenness”, also known asthe Normalized Difference Vegetation Index, is commonly used to estimate vegetation density and health. They also tracked a faint reddish light that plants emit during photosynthesis, when a plant absorbs sunlight to convert carbon dioxide and water into food, its chlorophyll “leaks” unused photons. This faint light is called solar-induced fluorescence, and it’s a telltale sign of flourishing vegetation.
Growing plants emit a form of light detectable by NASA satellites orbiting hundreds of miles above Earth. Parts of North America appear to glimmer in this visualization, depicting an average year. Gray indicates regions with little or no fluorescence; red, pink, and white indicate high fluorescence. NASA Scientific Visualization Studio Not visible bythe naked eye, plant fluorescence can be detected by instruments aboard satellites such as NASA’s Orbiting Carbon Observatory-2 (OCO-2). Launched in 2014, OCO-2 has observed the U.S. Midwest fluorescing strongly during the growing season.
Feldman said the findings highlight the vital role that plants play in moving carbon around Earth — a process called the carbon cycle. Vegetation, including crops, forests, and grasslands, forms a vast carbon “sink,” absorbing excess carbon dioxide from the atmosphere.
“A finer understanding of how plants thrive or decline day to day, storm by storm, could help us better understand their role in that critical cycle,” Feldman said.
The study also included researchers from NASA’s Jet Propulsion Laboratory in Southern California, Stanford University, Columbia University, Indiana University, and the University of Arizona.
By Sally Younger
NASA’s Earth Science News Team
Details Last Updated Dec 11, 2024 Related Terms Climate Change Earth Global Precipitation Measurement (GPM) Goddard Space Flight Center Jet Propulsion Laboratory Water on Earth
Keep Exploring Discover More Topics From NASA Earth
Your home. Our Mission. And the one planet that NASA studies more than any other.
NASA is a global leader in studying Earth’s changing climate.

NASA’s unique vantage point helps us inform solutions to enhance decision-making, improve livelihoods, and protect our planet.


 6 min read Found: First Actively Forming Galaxy as Lightweight as Young Milky Way
 5 min read Scientists Share Early Results from NASA’s Solar Eclipse Experiments
 8 min read NASA’s Hubble Celebrates Decade of Tracking Outer Planets
